Isn’t it curious that people manage to watch three movies in a day but cringe at the idea of reading through an equally interesting book in a week? It’s relatively simple. A majority of people prefer visual material for informative purposes, not just for entertainment. Studies show that the brain stores visual information more quickly as compared to written information.
It’s biological. People prefer eye candies; something that stimulate thought processes and are fun to look at. One can effortlessly comprehend patterns, shapes and colors – and therefore charts, graphs and infographics.
If you wish to convey your message in an attractive and impactful way, you must make use of images to turn data into an easily digestible, bite sized chunks. Great user experience is a product of creative visual illustrations. There are a number of free tools available to make this happen. Following are three ways to gain more traffic to your website, blogs or presentations by making them more visually attractive.
1. Infographics
Inforgrapics is raw data that has been converted into something people would like to see. It compresses complex ideas in a visual to form to make it quickly and easily understandable to the target audience. Inforgraphics utilized three elements to convey complicated information. Text, statistics/data and visuals.
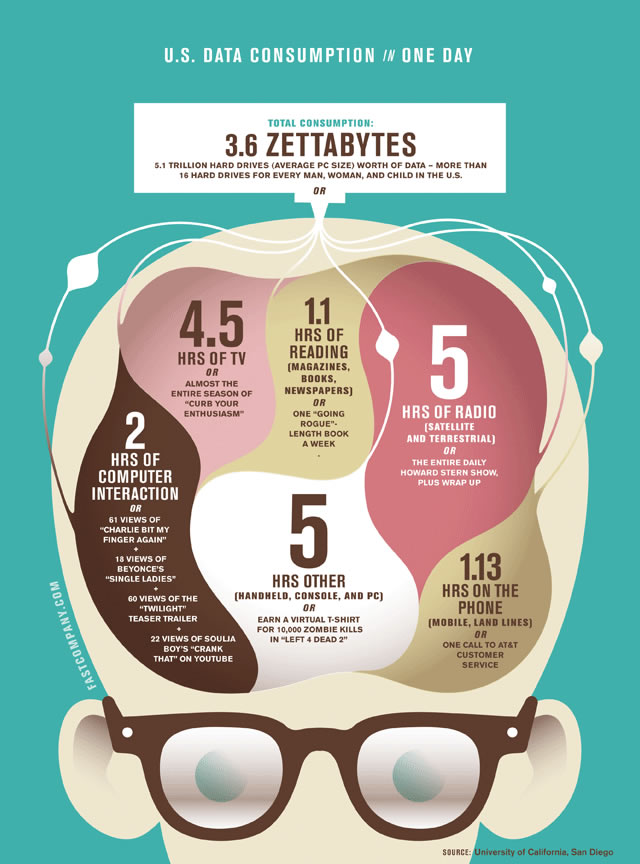
(Here’s a cool infographic about infographics.)
Infograpics are not just visual eye candies designed to relay information, they are created in a way that appeals to user and increases the sharebility of that information on social media.
Apps to help you get started: Visme is a cool free tool for creating beautiful infographics. Prezi can also be used to create cool presentations.
2. Videos
Videos are a great way to compress information for your clients. The uses range from preparing a demo of a product, corporate communications to entertainment videos. Statistics reveal that an individual watches 186 videos per month, from all sectors of the industry ranging from educational videos to entertainment channels.
Videos deliver your message effortlessly and tend to engage the audience in ways that an image or infographic just cannot. Quite a lot of companies have failed to follow the trend in their marketing endeavors. Its imperative not to get left behind in such basics as they are building blocks that make you stand out from the competition.
Apps to help you get started: Start with free tools like Animoto and Masher.
3. Heat Maps
Heat maps are visual aids that numeric information in the forms of color patterns. The colors indicate the various levels of the data such as distance, weight or height. A fine example would be the ability to track the clicks on your website, such as which particular page or feature users click on the most. Such data helps you isolate the elements on the website that aren’t getting as much attention. This helps in taking measures to change that buy utilizing a different strategy.
Apps to help you get started: Some tools to experiment with are Crazy Egg, Click Heats, and Clicktale.
A trend has set in present information in a visual format. Online users demand web pages that appeals to them, and anything that is not interesting is not tolerated. Your competition is already doing it to get maximum eyeballs on their web presence, which leaves you with two choices go visual or get left behind.
A picture speaks a thousand words
No comments:
Post a Comment